A few weeks ago here on Copyblogger, Demian Farnworth presented the infographic as the Salvador Dalí of content marketing — the most interesting person at the cocktail party.
More than just a superficial presence, an infographic is a significant asset pillar with diverse possibilities that help you grow your media empire.
Today, let’s equate the Internet to the world of pop music. In this case, infographics are The Beatles.
They’re irresistible. They create massive hits. At their best, they balance style and substance.
They can be relentlessly imaginative. And like John, Paul, George, and Ringo, they can communicate sophisticated ideas to a mass audience.
Yep, they’re lovable. How lovable?
The factoid below comes from a 2012 infographic by NeoMam Studios.
Even stories about infographics sizzle. I wrote “The Most Important Thing You Need to Know About Infographics” and it climbed to the number one spot on my chart last year.
Before we brainstorm infographic ideas, let’s discuss why infographics work.
Why do we love infographics?
Here are 15 reasons I’ve assessed:
- They’re so webable. First, I must offer my theory and ask you to live with my funny new word. Although data visualizations exist in traditional media, they’ve exploded in the digital age because they perfectly suit new media and the devices we use to consume information.
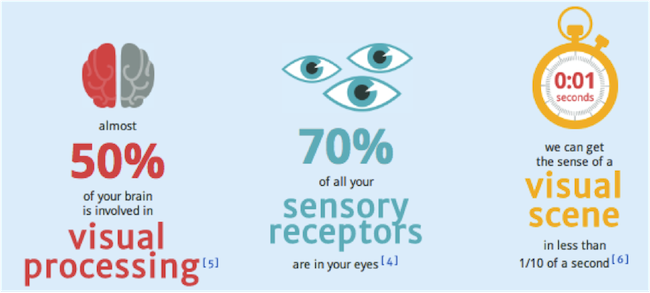
- We’re visual creatures. The fun, interactive infographic, “13 Reasons Why Your Brain Craves Infographics,” makes this case with powerful data points.
- They simplify complex ideas. Infographics aid comprehension by pairing text with straightforward pictures.
- They’re easy to share. We love to share information we find valuable. It feeds our appetites for being conduits of wisdom. Creators and publishers of infographics encourage you to share their content and often simplify the process by providing code you can embed on your website.
- They’re familiar. The general recipe for infographics features ingredients we’re comfortable with: illustrations, icons, charts, diagrams, and captions. The familiarity speaks to us and obliterates any objections.
- They travel well. Infographics are multi-screen portable. They translate nicely to slides and also tend to work on paper.
- They’re fast. Up above, in Number Two, you see an interesting data point about how fast we’re able to process visual information. The process of reading takes time. Given our short attention spans, the speed with which we can absorb visual information makes infographics attractive.
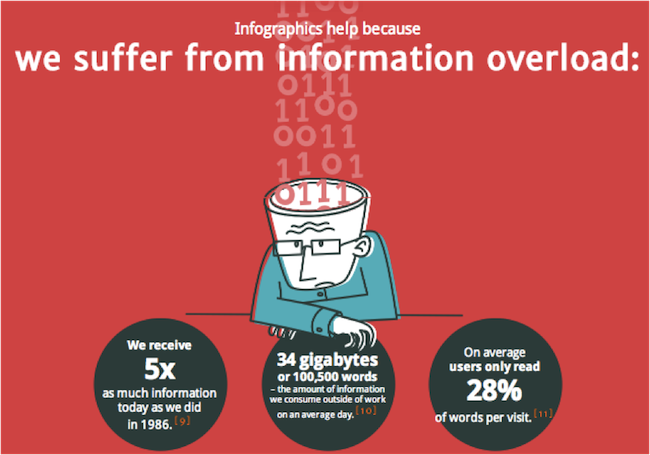
- They’re less taxing. A related, but slightly different idea than the one above about speed is we give ourselves a little break when we digest information aided by visuals. We encounter a lot of information daily. We can only read so much. The data below comes from:
- Welcome to the information age — 174 newspapers a day, The Telegraph.
- Measuring Consumer Information, International Journal of Communication, Vol 6.
- How Little Do Users Read?
- People thrive on data. We’re drawn to data and proof points. I like this presentation from Juice, Inc. that explains how data drives exploration, understanding, presentation, discovery, motivation, learning, and above all, “doing.”
- They tell stories. A lot of infographics use storytelling tactics including characters, conflicts, problems, and resolutions. Stories hold our attention as we relate to characters and go on journeys with them.
- They promote branding. When infographics are republished, a brand travels with the image, which usually includes a logo and URL.
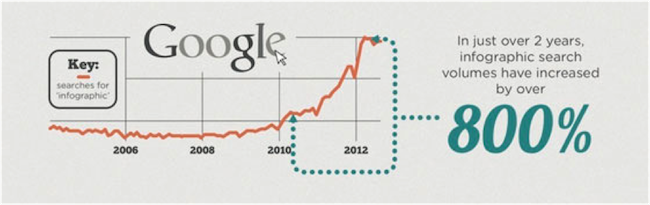
- People search for them. Because they’re so useful (and often entertaining), people search for infographics, as evidenced in the statistic presented above. Since search engines can’t index the content within an image, headlines often appear with the explicit label “Infographic”.
- People collect them. Do you do this? I sure do. I stash infographics for safekeeping on Pinterest and in my swipe files if I suspect I’ll want to reference them (or use them) again in the future.
- They dominate the page. I believe one of the many factors that make infographics appealing is they tend to dominate a webpage.
- They’re generally large and colorful. Unlike plain text, infographics defeat distractions and help us focus on the content.
Ready to create your own infographic?
Here are 25 infographic types, themes, and concepts:
- Process. Create an infographic to explain a process. They’re ideal for breaking down and simplifying a multi-step process that may otherwise appear intimidating.
- Comparison. These images may include sections such as: before and after, this vs. that, old way vs. new way, us and them, etc.
- Timeline. Infographics help illustrate the evolution of a subject matter.
- Roundup. Various types of roundups, such as quotes, reviews, favorites, etc. can be presented as a collection.
- Components. Just as it’s useful to break down a process into steps, you can decouple the components of just about anything to aid understanding, i.e., an engine, recipe, or team.
- Instructions. Use an infographic to simplify complex tutorials or communicate how to complete a task.
- Charts and tables. Simple charts or tables featuring icons or images representing a topic create visual interest.
- Categories. Take any category of interest to your audience and tell a story with an infographic. Check out one of my favorites, “The Genealogy of Pop/Rock Music”. Amazing.
- Study of a “universe.” Produce massive visual collections on: beers, bands, books, bikes, beaches, etc. Here’s The Ultimate Infographic on Infographics from Curata.
- Warnings. This popular article style tends to be irresistible. A list of dangers, myths, or mistakes is a powerhouse for infographics, too.
- Metaphor. I love it when an interesting metaphor presents a concept. I bet you do too.
- Résumé. Job hunting? The résumé as an infographic is such an engaging idea, services such as vizualize.me and kinzaa.com have sprung forth.
- Report. Research and survey results offer great value in traditional report formats, but the same information, or highlights from it, make compelling infographics.
- Product or service. You may not score a viral hit with an infographic that showcases what you sell, but you’re likely to have an engaging tool that presents your goods to potential buyers.
- Trend. Showcasing a trend in an infographic makes a newsworthy story even more fun.
- Past to present. This is another timeline idea that displays the history of a topic.
- Place or event. Any place (from a nation to a campground) or any event (from a war to a conference) can be summarized in an infographic.
- Guide. A rather obvious theme, I know, but any “how to” begs to be transformed into an infographic.
- Family tree. These can be downright intoxicating. You can use a tree, flow chart, or similar symbols to explain relationships.
- Cause and effect. You probably see a “this caused that” form of presentation more than you realize. It’s simple and smart.
- Biography. Perform a search for “biography of Steve Jobs infographic” and you’ll discover some amazingly creative graphics. Study them for inspiration.
- Story. Simple one here. Tell a story, like a picture book.
- Manifesto. This approach can be a stellar branding tool. Write a manifesto that defines what you stand for and have a great designer create an infographic that makes you proud.
- List. Don’t ignore this age-old, can’t-miss tactic for communicating fascinating, useful content.
- Acronym. Spell out an acronym or abbreviation, with pictures, of course, and you’ll have a double-whammy simplification of a robust idea.
Grow your audience with infographics
Which type of infographic will you make to reach and educate a larger audience?
Share your thoughts about incorporating infographics into your content strategy over on Google+.
Editor’s note: If you found this post useful, we recommend that you read How to Make Winning Infographics Without Risk by Demian Farnworth.
Flickr Creative Commons Image via Saad Faruque.


![[08] 10 Goals that Make Content Marketing Meaningful](../../rainmaker.fm/wp-content/uploads/2017/07/sites-008.jpg)